
Search for the EB-2 NIW approval rate and you will find confident numbers with no source attached. This post uses only the figures USCIS publishes in its own Form I-140 data files, so you can see what actually happened in FY2025 and FY2026 and plan your filing around it.
Educational information, not legal advice. NIWPack is a brand operated by Kooemma Digital Holdings LLC. NIWPack is written by a self-filer, not an attorney, and is not a law firm. Consult a licensed immigration lawyer for advice on your specific facts.
Where these numbers come from
USCIS publishes quarterly Form I-140 data broken out by classification, including a separate row for the National Interest Waiver (NIW). Each quarter lists receipts, approvals, denials, and pending cases. USCIS does not publish an "approval rate," so the percentages below are our own calculation: approvals divided by approvals plus denials in that quarter.
Two caveats before the numbers. First, a decision in one quarter usually relates to a petition filed many months earlier, so the rate describes the decisions USCIS made, not the odds for a petition filed today. Second, USCIS revises its counts in later versions of these files, so small differences are normal.
The EB-2 NIW approval rate, quarter by quarter
| Period | Approvals | Denials | Approved share |
|---|---|---|---|
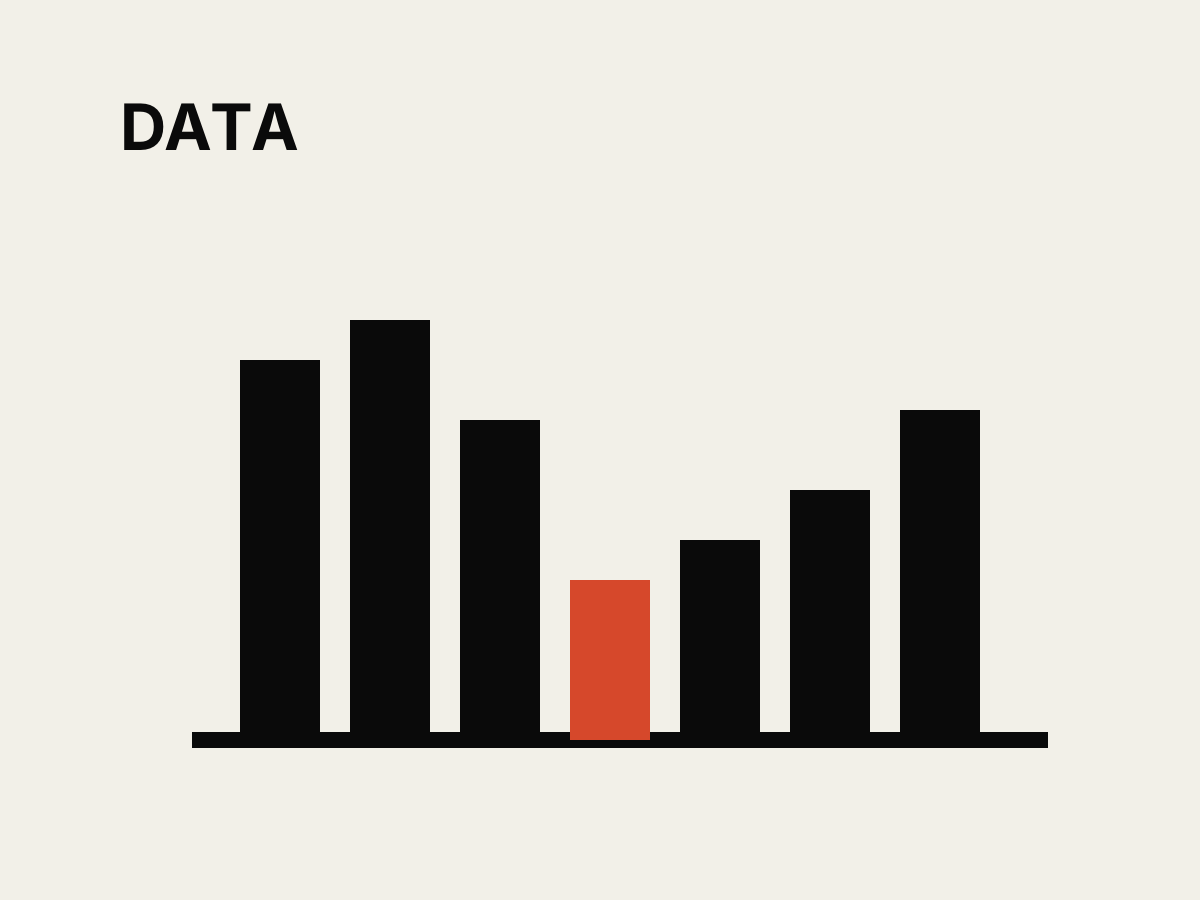
| FY2025 Q1 | 4,683 | 2,790 | 62.7% |
| FY2025 Q2 | 6,591 | 3,206 | 67.3% |
| FY2025 Q3 | 5,290 | 4,511 | 54.0% |
| FY2025 Q4 | 2,968 | 5,356 | 35.7% |
| FY2026 Q1 | 2,365 | 3,200 | 42.5% |
| FY2026 Q2 | 3,038 | 3,282 | 48.1% |
| FY2026 Q3 | 3,835 | 3,103 | 55.3% |
Across all of FY2025, USCIS approved 19,532 NIW petitions and denied 15,863, an approved share of about 55%. For the first three quarters of FY2026, it approved 9,238 and denied 9,585, or about 49%.
Three things this data tells you
1. Standards tightened in 2025, and decisions reflected it. The drop from roughly two thirds approved early in FY2025 to roughly one third in the fourth quarter lines up with the period after USCIS's January 15, 2025 policy update (PA-2025-03). That update kept the Matter of Dhanasar framework but asked for stronger, more specific evidence, especially on national importance and on recommendation letters. We cannot prove cause from quarterly totals alone, but the timing is hard to ignore.
2. Approvals are recovering, but this is not a rubber stamp. The approved share has risen each quarter of FY2026, to about 55% in the third quarter. Even so, close to half of recent decisions were denials. A petition that would have passed in 2023 on general praise and a long CV is exactly the kind that struggles now.
3. The queue is growing. USCIS had 74,392 NIW petitions pending at the end of FY2025 and 96,297 at the end of the third quarter of FY2026. Receipts slowed (40,363 in the first three quarters of FY2026, against 66,276 in all of FY2025), but USCIS is deciding fewer cases than it receives. Expect long waits unless you pay for premium processing.
What the approval rate does not tell you
A national average says little about your petition. It mixes strong and weak cases, petitions with and without attorneys, and every field from oncology to software. It does not tell you how many denials could have been avoided, or how many approvals followed a request for evidence first. USCIS does not publish NIW-specific RFE rates, so be wary of anyone quoting a precise figure for one.
What the trend does support is simple: the margin for a vague petition has shrunk.
How to put your petition on the right side of these numbers
- Make the proposed endeavor specific. Name the work, the problem it addresses, and who benefits beyond your employer. Vague endeavors are the most common target of Prong 1 challenges.
- Prove national importance with independent evidence, such as government reports, adoption by other organizations, and citations, rather than your own description of how important your field is.
- Show you are well positioned with a track record: results, products in use, funding, publications, and a realistic plan with progress already made.
- Get recommenders who know your work from the outside. Letters should cite specific contributions and their impact, not repeat your résumé.
- Index every exhibit and reference it in the petition letter, so the officer never has to hunt for proof.
- File complete. Since August 2026, USCIS officers can deny a petition missing required initial evidence without first sending a request for evidence.
The bottom line
The honest answer to "what is the EB-2 NIW approval rate?" is that it moved a lot in the last two years: from about 67% to about 36% and back to about 55% of decisions. The petitions that make up the approved half tend to share one quality. They make the officer's job easy, with a specific endeavor, independent proof, and an organized record.
If you want to build that kind of record yourself, the EB-2 NIW Complete Self-Filer's Pack includes a sequenced self-filing guide, two fully worked example petitions, an evidence and exhibit index template, and recommendation letter templates written for the post-2025 standard.
Source: USCIS Form I-140 data files for FY2025 Q4 and FY2026 Q3 (uscis.gov). Percentages calculated by NIWPack.